IC Markets Trang chủ Đăng nhập Web Trader Liên hệ chúng tôi
IC Markets Social IC Markets Social

Information Hub for
Serious Traders

  • Thông tin về chúng tôi
  • Mở tài khoản giao dịch
  • Mở tài khoản giao dịch demo
  • Truy cập vào blog
  • THĂM CỦA CHÚNG TÔI BLOG
IC Markets Social
  • Thông tin về chúng tôi
  • Mở tài khoản giao dịch
  • Mở tài khoản giao dịch demo
  • Truy cập vào blog
  • THĂM CỦA CHÚNG TÔI BLOG
January 5, 2023North_American_Stocks_ptIC Markets

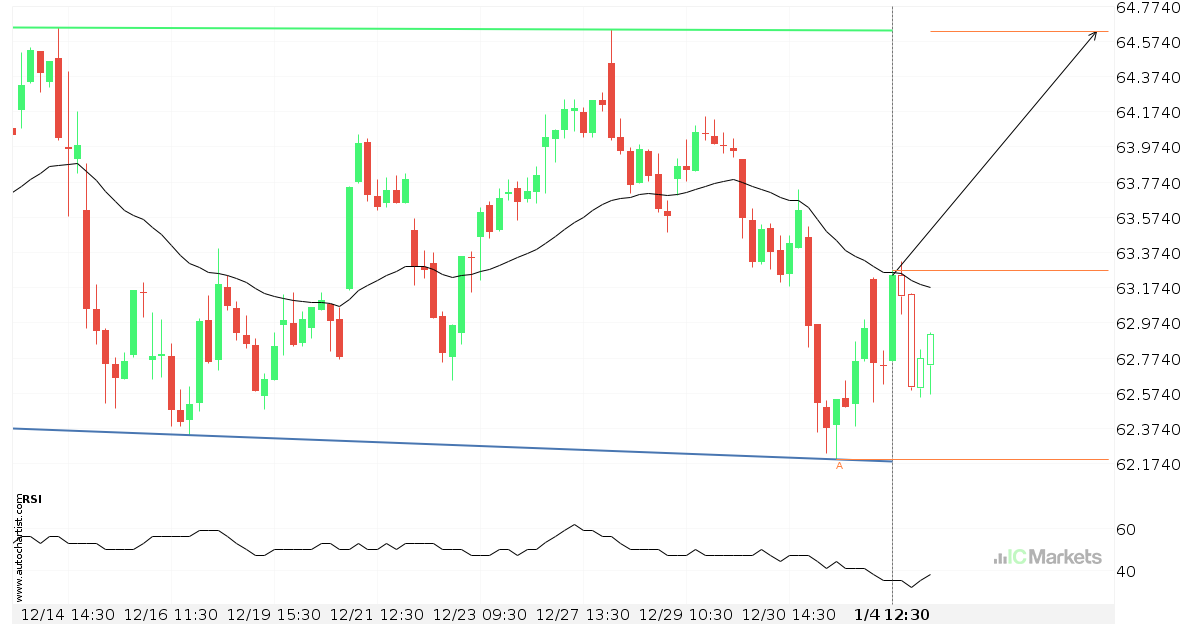
Coca-Cola Co. approaching resistance of a Rectângulo

Coca-Cola Co. is approaching the resistance line of a Rectângulo. It has touched this line numerous times in the last 24 days. If it tests this line again, it should do so in the next 2 days.

Read more
January 4, 2023North_American_Stocks_ptIC Markets

Breach of important price line imminent by US Tech 100 Index

US Tech 100 Index is moving towards a line of 11097.2998 which it has tested numerous times in the past. We have seen it retrace from this position in the past, so at this stage it isn’t clear whether it will breach this price or rebound as it did before. If US Tech 100 Index […]

Read more
January 3, 2023North_American_Stocks_ptIC Markets

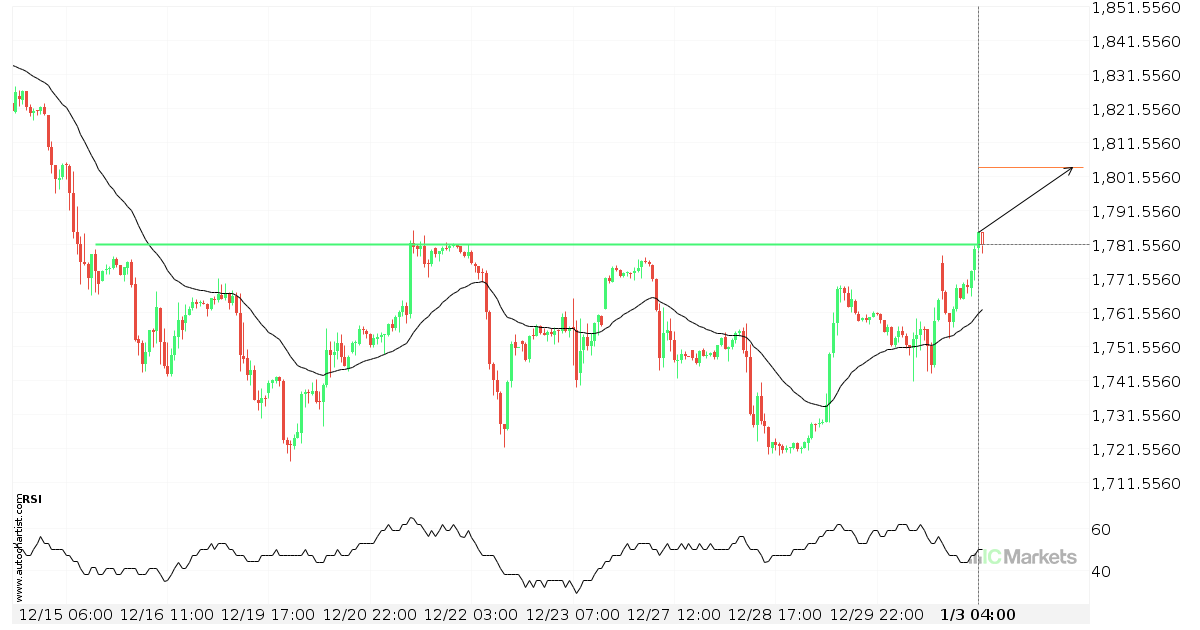
Important price line breached by US Small Cap 2000 Index

US Small Cap 2000 Index has broken through 1781.6700 which it has tested numerous times in the past. We have seen it retrace from this price in the past. If this new trend persists, US Small Cap 2000 Index may be heading towards 1804.1851 within the next 3 days.

Read more
December 30, 2022North_American_Stocks_ptIC Markets

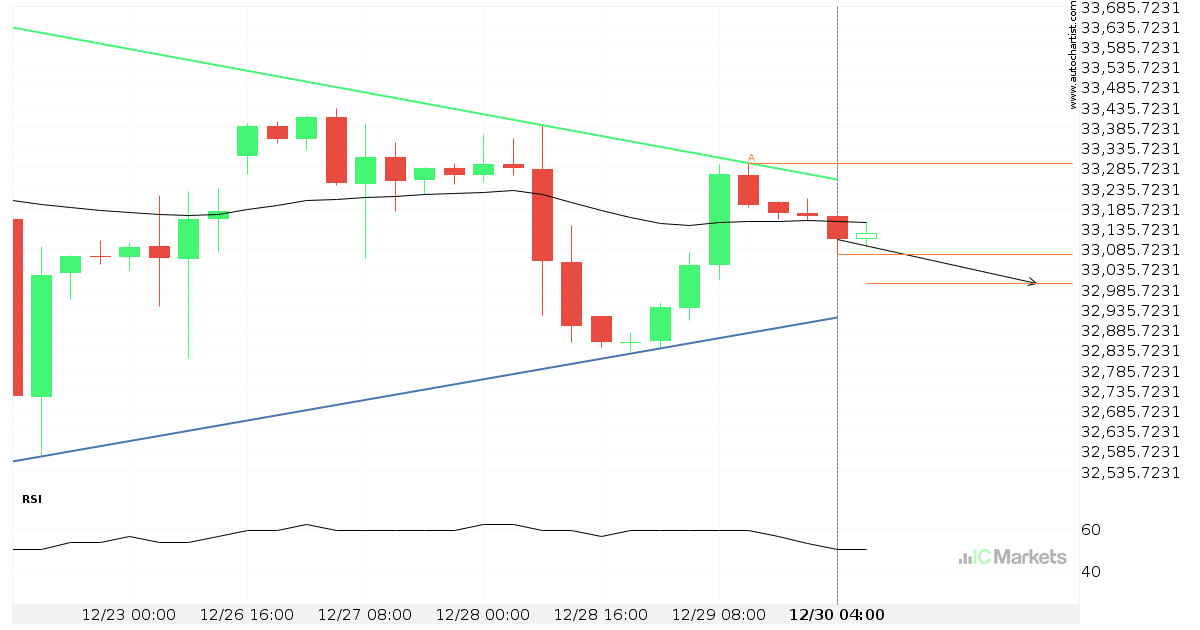
Will US Wall Street 30 Index have enough momentum to break support?

US Wall Street 30 Index is heading towards the support line of a Triângulo and could reach this point within the next 2 days. It has tested this line numerous times in the past, and this time could be no different from the past, ending in a rebound instead of a breakout. If the breakout […]

Read more
December 29, 2022North_American_Stocks_ptIC Markets

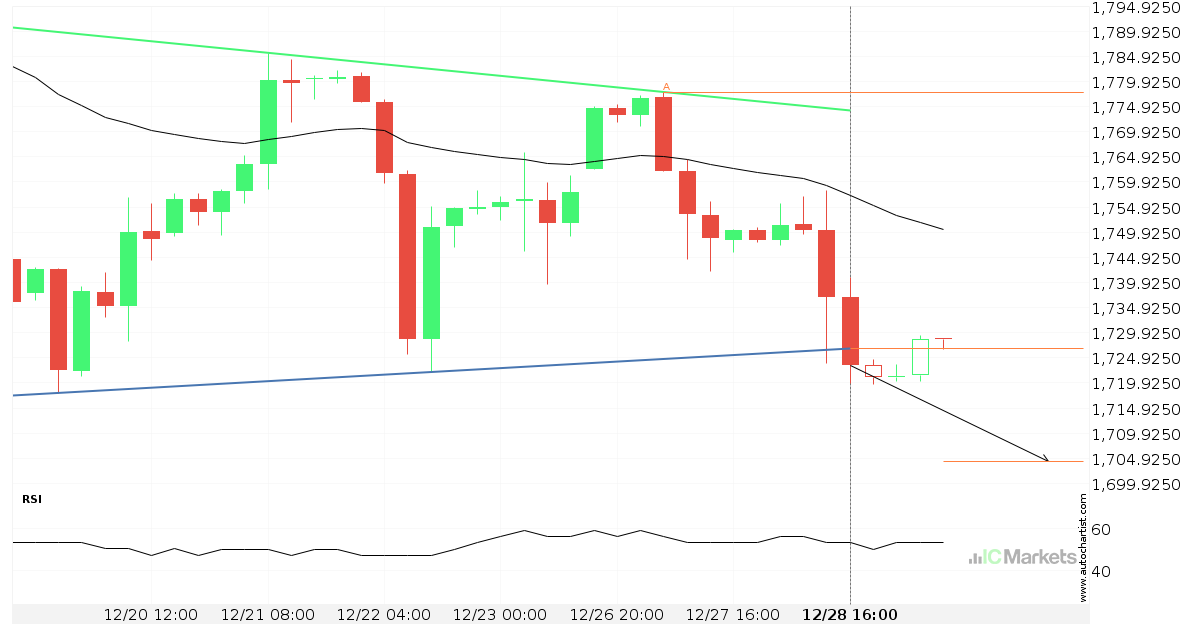
US Small Cap 2000 Index has broken through support

US Small Cap 2000 Index has broken through a support line. It has touched this line at least twice in the last 10 days. This breakout may indicate a potential move to 1704.3230 within the next 2 days. Because we have seen it retrace from this position in the past, one should wait for confirmation […]

Read more
December 28, 2022North_American_Stocks_ptIC Markets

US Small Cap 2000 Index – getting close to psychological price line

US Small Cap 2000 Index is moving towards a resistance line. Because we have seen it retrace from this level in the past, we could see either a break through this line, or a rebound back to current levels. It has touched this line numerous times in the last 7 days and may test it […]

Read more
December 27, 2022North_American_Stocks_ptIC Markets

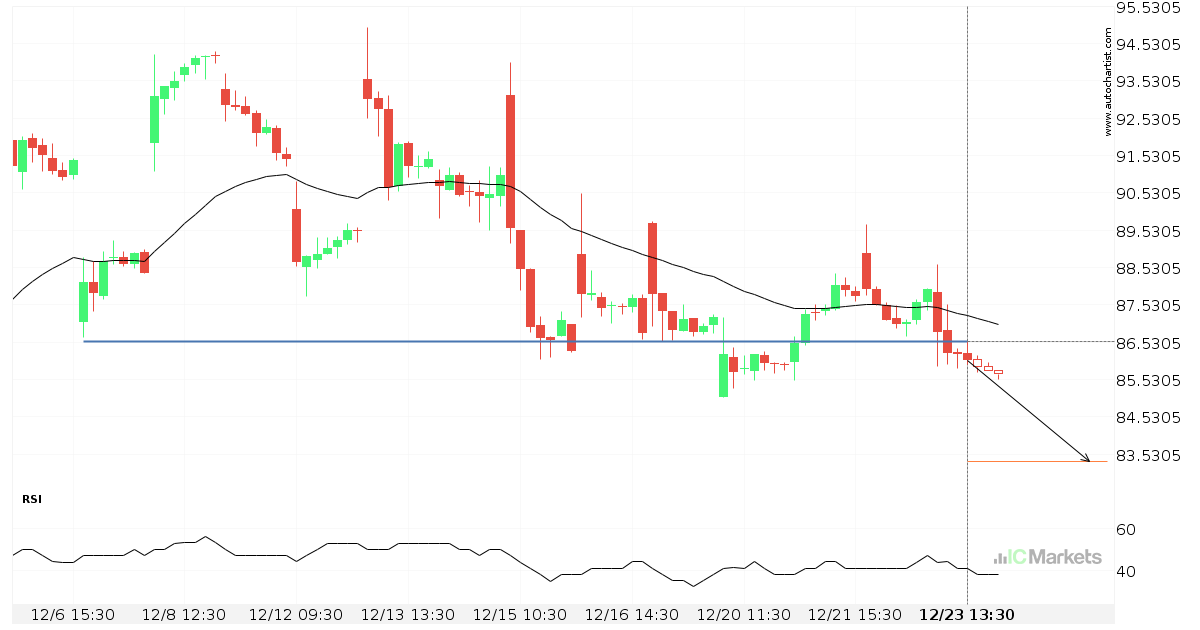
Alibaba Group Holding Limited – psychological price line breached

Alibaba Group Holding Limited has broken through a support line. Because we have seen it retrace from this price in the past, one should wait for confirmation of the breakout before trading. It has touched this line numerous times in the last 17 days and suggests a possible target level to be around 83.3395 within […]

Read more
December 26, 2022North_American_Stocks_ptIC Markets

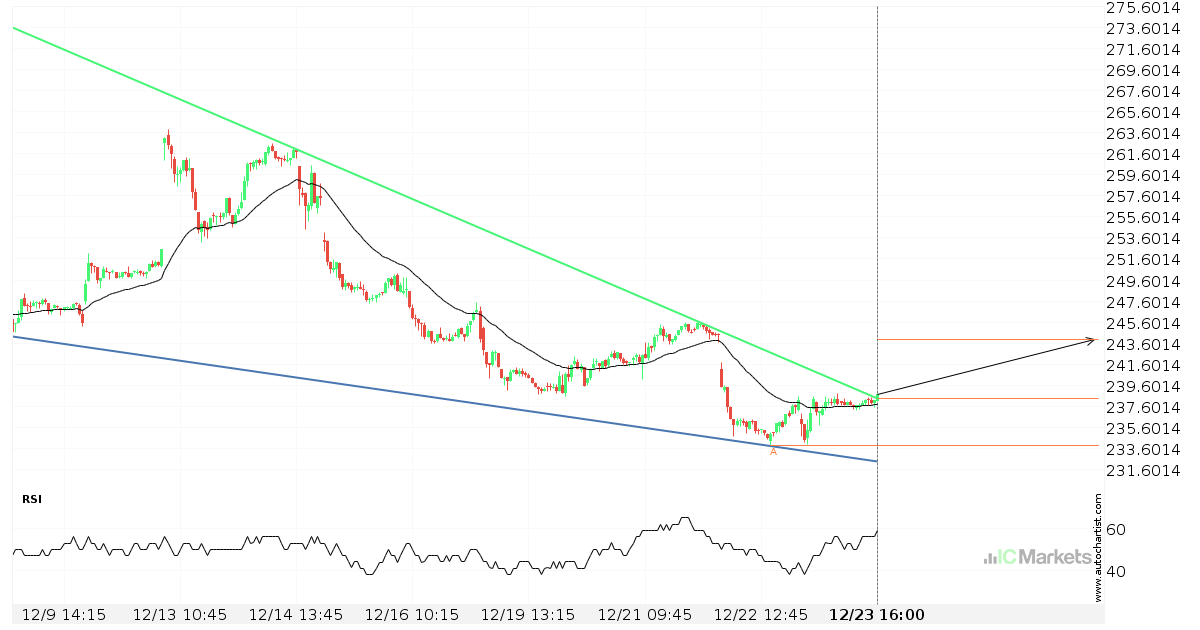
Microsoft Corporation has broken through resistance

Microsoft Corporation has broken through a resistance line. It has touched this line at least twice in the last 16 days. This breakout may indicate a potential move to 243.9393 within the next 23 hours. Because we have seen it retrace from this position in the past, one should wait for confirmation of the breakout […]

Read more
December 23, 2022North_American_Stocks_ptIC Markets

Possible breach of support level by US Tech 100 Index

US Tech 100 Index is moving towards a support line which it has tested numerous times in the past. We have seen it retrace from this line before, so at this stage it isn’t clear whether it will breach this line or rebound as it did before. If US Tech 100 Index continues in its […]

Read more
December 22, 2022North_American_Stocks_ptIC Markets

Tesla Inc. experienced 8 consecutive 4 hour bearish candles

For those of you that don’t believe in trends, this may be an opportunity to take advantage of an exceptionally large amount of consecutive bearish candles on Tesla Inc.. The movement has happened over the last 6 days. For those trend followers among you, you may think about riding this possible trend.

Read more
  • 1
  • 2
  • 3
  • …
  • 40
  • 41
  • 42
  • 43
  • 44
  • 45
  • 46
  • …
  • 87
  • 88
  • 89

Recent Posts

  • Either a rebound or a breakout imminent on SILVER
  • GOLD Nível visado: 2976.3601
  • A potential bearish movement on GOLD
  • มีโอกาสเกิดการเคลื่อนตัวแบบ bearish บน GOLD
  • Posible gran movimiento en el AUDJPY

Recent Comments

    Translation


     Edit Translation

    Mở & nạp tiền vào tài khoản nhanh chóng

    Giao dịch trong vòng vài phút!

    BẮT ĐẦU THỬ TÀI KHOẢN DEMO MIỄN PHÍ

    Giao dịch Forex

    • Tổng quan về Tài khoản
    • Mở Tài khoản
    • Khởi chạy Web Trader

    Thông số Giao dịch

    • Chênh lệch và Hoa hồng
    • Phạm vi các Thị trường
    • Giờ Giao dịch
    • Nạp tiền
    • Rút tiền

    About IC Markets

    • Help Center
    • Tại sao lại chọn IC Markets?
    • Quản lý
    • Tài liệu Pháp lý
    • Liên hệ với Chúng tôi


    Forex Trading

    • Accounts Overview
    • Open an Account
    • Launch Web Trader

    Trading Specifications

    • Spreads and Commissions
    • Range of Market
    • Trading Hours
    • Funding
    • Withdrawal

    About IC Markets

    • Chat with a Specialist 24/7
    • Why IC Markets
    • Regulation
    • Legal Documents
    • Liên hệ chúng tôi

    Khước từ trách nhiệm: Tài liệu này là tài liệu marketing mà ở đó tất cả tài liệu marketing đều được xuất bản chỉ nhằm mục đích thông tin. Tài liệu này không chứa và không nên được coi là chứa - lời khuyên và khuyến nghị đầu tư, hoặc đề xuất thực hiện bất kỳ hành động nào với các công cụ tài chính. Các widget được tích hợp thuộc về các tác giả độc lập bên ngoài, và IC Markets không chịu trách nhiệm về nội dung và tác động của chúng đối với giao dịch.

    Bảo lưu mọi quyền. Quan điểm của tác giả có thể không trùng khớp với quan điểm của biên tập viên blog. Khi sao chép các tài liệu từ trang này hoặc kết nối với bản tin RSS để xuất bản lại các bài viết của chúng tôi, một liên kết tới IC Markets hoặc thuộc tính trong định dạng ‘Blog của IC Markets’ được yêu cầu. Đối với các thắc mắc nói chung, vui lòng liên hệ với phòng biên tập qua biểu mẫu trên trang Liên hệ với chúng tôi.

    Cảnh báo về Rủi ro: Giao dịch Phái sinh tiềm ẩn mức độ rủi ro cao với vốn của bạn và bạn chỉ nên giao dịch với số tiền mà bạn có thể để mất. Giao dịch Sản phẩm phái sinh có thể không phù hợp với mọi nhà đầu tư, do đó vui lòng đảm bảo rằng bạn hiểu đầy đủ các rủi ro có liên quan và tìm kiếm sự tư vấn độc lập nếu cần. Tuyên bố Tiết lộ sản phẩm (PDS) phải được cân nhắc trước khi tham gia bất kỳ giao dịch nào với chúng tôi.

    Nội dung của trang này chỉ nhằm mục đích thông tin chung và không cân nhắc tới tình hình cá nhân, mục tiêu hoặc nhu cầu tài chính của bạn. Việc đảm bảo các sản phẩm mà chúng tôi cung cấp có phù hợp với nhu cầu cụ thể của bạn hay không hoàn toàn tùy thuộc vào bạn. Bạn không nên giao dịch với chúng tôi trừ khi bạn hiểu các tính năng và rủi ro của các sản phẩm mà chúng tôi cung cấp. Điều này có nghĩa là bạn có thể tìm kiếm sự tư vấn động lập trước khi bắt đầu giao dịch với chúng tôi.

    © 2022 Raw Trading Ltd | All rights reserved.
    • Sample Page